Day trading is a high-paced form of stock trading that requires quick decisions, precise analysis, and well-timed executions. While some traders might rely on gut feeling or follow trends blindly, successful day traders rely on thorough stock analysis. Whether you are just starting out or looking to refine your strategy, learning how to analyze stocks effectively is key to mastering the art of day trading.
In this 2500-word guide, we’ll break down the core components of stock analysis for day trading, including key tools and indicators, chart patterns, technical analysis, and risk management strategies.
Table of Contents:
- What is Day Trading?
- Key Factors for Stock Selection in Day Trading
- Fundamental vs. Technical Analysis: What Day Traders Focus On
- Essential Technical Indicators for Day Traders
- How to Use Chart Patterns in Day Trading
- Volume and Liquidity: The Cornerstones of Stock Analysis
- Understanding News and Market Sentiment
- Using Level 2 Quotes and Time & Sales Data
- Risk Management and Position Sizing
- Day Trading Psychology: Controlling Emotions and Staying Disciplined
- Conclusion: Building Your Day Trading Analysis Toolkit
1. What is Day Trading?
Day trading refers to the practice of buying and selling financial instruments within a single trading day, often closing out all positions before the market closes. The goal of day trading is to take advantage of short-term price movements, typically driven by market volatility, liquidity, and news. Unlike swing traders or long-term investors, day traders rarely hold positions overnight.
2. Key Factors for Stock Selection in Day Trading
Stock selection is the starting point of successful day trading. To maximize your chances of success, you should focus on stocks that meet the following criteria:
a) Volatility
Day traders thrive on price fluctuations. Stocks with high volatility provide more opportunities for profit as their prices tend to move quickly throughout the day.
b) Liquidity
Liquidity refers to how easily shares of a stock can be bought and sold without causing a major impact on its price. Stocks with higher liquidity, usually indicated by higher daily trading volumes, are easier to enter and exit at the desired prices. High liquidity means tighter spreads and quicker execution.
c) Volume
Volume refers to the number of shares traded within a given period. High-volume stocks tend to have more predictable price movements, and they offer more trading opportunities for day traders.
d) Catalysts
Day traders often focus on stocks that have catalysts driving price movements. A catalyst could be an earnings report, news release, or a major event that affects a stock’s value. Catalysts typically lead to increased volatility and volume, providing prime opportunities for short-term trades.
3. Fundamental vs. Technical Analysis: What Day Traders Focus On
a) Fundamental Analysis in Day Trading
While fundamental analysis focuses on a company’s long-term prospects, including its financial health, business model, and growth potential, day traders tend to give it less weight. For long-term investors, fundamental analysis is key. However, day traders may use fundamental data like earnings reports or economic releases as short-term catalysts to inform their trading decisions.
For example:
- Earnings Surprises: A company that beats earnings expectations might experience a sudden increase in stock price, providing an opportunity for day traders.
- Analyst Upgrades/Downgrades: Changes in analyst recommendations can trigger volatility in a stock.
b) Technical Analysis in Day Trading
Technical analysis, on the other hand, is the bread and butter of day trading. This type of analysis involves studying charts, price patterns, and technical indicators to predict future price movements. Since day traders focus on short-term trades, technical analysis is crucial for identifying entry and exit points.
4. Essential Technical Indicators for Day Traders
Day traders use a variety of technical indicators to analyze stocks and determine the best moments to enter or exit a trade. Let’s look at some of the most commonly used indicators.
a) Moving Averages (MA)
Moving averages smooth out price data and help traders identify the overall direction of the trend. The two most popular types are the simple moving average (SMA) and the exponential moving average (EMA).
- SMA: An average of past prices over a specific time period (e.g., 50-day or 200-day SMA).
- EMA: Places more weight on recent prices, making it more responsive to current market conditions.
Traders use moving averages to determine support and resistance levels, and crossover points between short-term and long-term moving averages often signal entry or exit points.
b) Relative Strength Index (RSI)
The RSI is a momentum oscillator that measures the speed and change of price movements. It ranges from 0 to 100, with readings above 70 considered overbought and readings below 30 considered oversold. RSI helps day traders identify potential reversal points.
c) Bollinger Bands
Bollinger Bands consist of a middle band (a simple moving average) and two outer bands that represent standard deviations from the moving average. When the price moves towards the upper or lower bands, it can indicate potential overbought or oversold conditions.
d) MACD (Moving Average Convergence Divergence)
The MACD is a trend-following momentum indicator that shows the relationship between two moving averages. It helps day traders identify changes in the strength, direction, and momentum of a stock’s price movement.
e) VWAP (Volume Weighted Average Price)
VWAP calculates the average price a stock has traded at throughout the day based on volume and price. Day traders use VWAP to determine whether a stock is trading above or below its average price, providing valuable insight into the strength of a trend.
5. How to Use Chart Patterns in Day Trading
Chart patterns are visual representations of price movements, and they can give you clues about the future direction of a stock. By learning to recognize these patterns, day traders can make better-informed trading decisions.
a) Candlestick Patterns
Candlestick patterns are popular among day traders because they offer detailed visual cues about the battle between buyers and sellers.
- Doji: A doji occurs when a stock’s opening and closing prices are almost identical, signaling indecision in the market.
- Hammer: A hammer indicates a potential reversal after a downtrend. It has a long lower wick and a small body.
- Shooting Star: The shooting star is the opposite of the hammer, signaling a potential reversal after an uptrend.
b) Continuation Patterns
These patterns indicate that the current trend is likely to continue.
- Triangles: Symmetrical, ascending, and descending triangles form when the price consolidates before breaking out in the direction of the trend.
- Flags and Pennants: These patterns indicate a brief pause in the current trend before resuming its direction.
c) Reversal Patterns
These patterns suggest a reversal in the current trend.
- Head and Shoulders: This pattern typically signals a reversal from an uptrend to a downtrend.
- Double Top/Double Bottom: These patterns form after a sustained trend and indicate a potential reversal.
6. Volume and Liquidity: The Cornerstones of Stock Analysis
a) Volume Analysis
Volume is a critical factor in day trading. It indicates how much of a stock is being traded, and higher volume often means higher volatility and more liquidity, which are essential for day traders. Volume spikes often occur before significant price movements, signaling that large traders or institutions may be entering or exiting positions.
Volume analysis can also confirm trends. For example, if a stock is in an uptrend and volume increases, it suggests that the trend is strong. Conversely, if volume decreases, it could indicate that the trend is losing momentum.
b) Liquidity Analysis
Liquidity ensures that you can enter and exit trades without slippage—when the actual executed price differs from the expected price due to a lack of buyers or sellers. High-liquidity stocks tend to have narrow bid-ask spreads, which means traders can enter and exit positions at desirable prices.
7. Understanding News and Market Sentiment
News and market sentiment play a huge role in day trading, especially for stocks that are highly reactive to announcements or events. Day traders must stay on top of the latest news, earnings reports, economic data, and geopolitical developments to gauge market sentiment and adjust their trading strategies accordingly.
a) Economic Data
Reports on unemployment, inflation, interest rates, and GDP can move markets significantly. Traders must be aware of the economic calendar to anticipate potential market movements.
b) Company-Specific News
Earnings reports, product launches, regulatory news, and analyst upgrades or downgrades can all impact stock prices dramatically. Day traders need to be aware of any upcoming company-specific events and be prepared to act accordingly.
8. Using Level 2 Quotes and Time & Sales Data
a) Level 2 Quotes
Level 2 quotes provide detailed information on the buy and sell orders for a stock, giving day traders insight into supply and demand. It shows the order book, which displays the highest bid prices (buyers) and the lowest ask prices (sellers). By analyzing Level 2 data, traders can gauge market sentiment and identify potential price movements based on order flow.
b) Time & Sales Data
Time & Sales data shows the actual trades executed in real-time, including the price, time, and size of each trade. This information helps traders identify large trades or “prints” that may signal the involvement of institutional traders. Watching Time & Sales alongside Level 2 can provide a clearer picture of market activity.
9. Risk Management and Position Sizing
Risk management is essential for protecting your capital in day trading. Even the best analysis can’t guarantee profits, so it’s important to manage your risk.
a) Setting Stop-Loss Orders
A stop-loss order automatically closes your position when the stock price reaches a predetermined level. This helps limit your losses and protect your capital.
b) Position Sizing
Determine the amount of capital you’re willing to risk on each trade. A common rule is to risk no more than 1-2% of your trading account on a single trade. By using this rule, you can survive a series of losing trades without depleting your account.
10. Day Trading Psychology: Controlling Emotions and Staying Disciplined
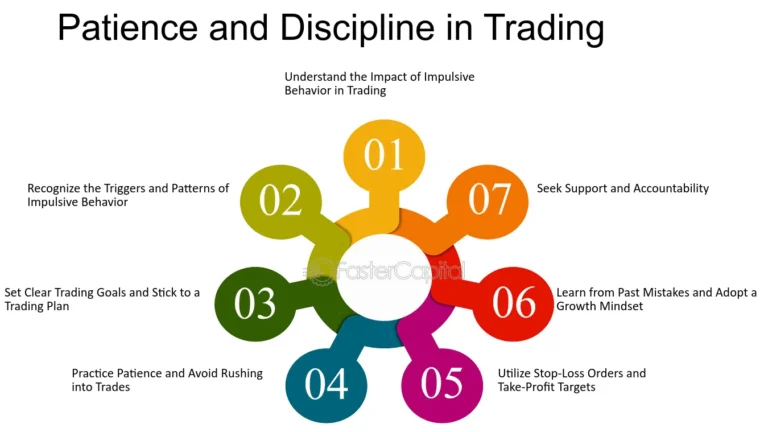
Day trading can be emotionally challenging due to the fast-paced nature of the market. Emotions like fear, greed, and impatience can lead to poor decisions. It’s important to develop mental discipline and stick to your trading plan.
a) Avoid Revenge Trading
Don’t let one losing trade affect your next trade. Trying to “get back” what you lost by making impulsive decisions often leads to larger losses.
b) Stay Consistent
Stick to your trading strategy and avoid jumping from one method to another based on short-term results. Consistency is key to long-term success.
11. Conclusion: Building Your Day Trading Analysis Toolkit
Successful day trading requires a solid understanding of technical analysis, market sentiment, and risk management. By learning to analyze stocks effectively, you can improve your trading decisions and maximize your chances of success. Start by focusing on a few key indicators and chart patterns, and refine your skills over time. With practice and discipline, you can build a day trading strategy that works for you.


