Cryptocurrency trading can be an exhilarating yet complex endeavor, and understanding how to read charts is a crucial skill for any trader. Charts provide valuable information about price movements, trading volume, and market trends, allowing traders to make informed decisions. This comprehensive guide will introduce you to the basics of cryptocurrency charts, the various types of charts available, and essential indicators and tools for analysis.
1. Understanding the Basics of Cryptocurrency Charts
What Are Cryptocurrency Charts?
Cryptocurrency charts visually represent price movements over time. They display historical data, enabling traders to identify trends, patterns, and potential future movements. Charts are essential for technical analysis, a method of evaluating assets based on statistical trends and historical price data.
Key Components of Cryptocurrency Charts
- Time Frame: Charts can represent data over various time frames, such as minutes, hours, days, or weeks. The chosen time frame will significantly impact the analysis and trading strategy.
- Price Axis: The vertical axis (Y-axis) shows the price of the cryptocurrency, while the horizontal axis (X-axis) represents time.
- Volume: Trading volume is often represented as bars beneath the price chart, indicating the number of assets traded during a specific period. Higher volume can signify stronger market interest.
- Candlesticks: Candlestick charts display the open, high, low, and close prices for a specific time frame, providing a visual representation of price movements.
2. Types of Cryptocurrency Charts
2.1 Line Charts
Line charts are the simplest form of charting, connecting the closing prices of a cryptocurrency over a specified period. They are useful for identifying long-term trends and overall price movements.
- Advantages: Easy to read, provides a clear view of price trends over time.
- Disadvantages: Lacks detail about intra-period price movements and does not include information about trading volume.
2.2 Bar Charts
Bar charts represent price movements using vertical bars. Each bar displays the opening, closing, high, and low prices for a specific time frame.
- Advantages: Offers more detail than line charts, allowing traders to see price fluctuations within the time period.
- Disadvantages: Can be less visually appealing and more complex to read than line charts.
2.3 Candlestick Charts
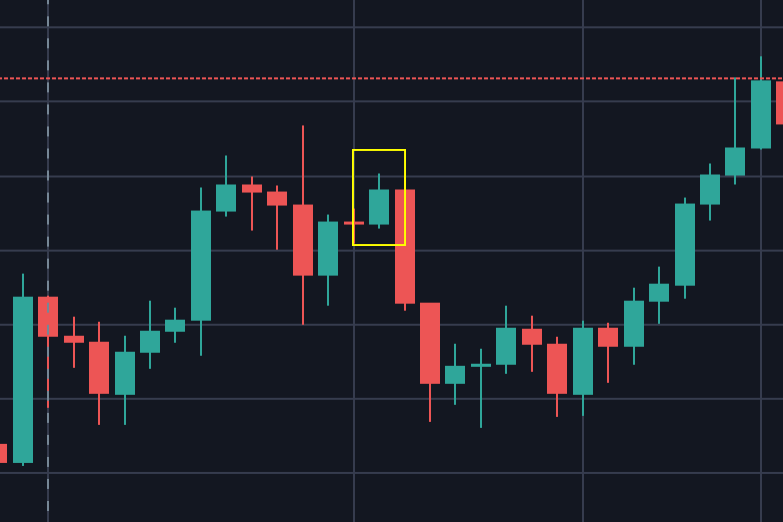
Candlestick charts are widely used in cryptocurrency trading and provide a wealth of information in a compact format. Each candlestick represents a specific time frame, displaying the open, high, low, and close prices.
- Advantages: Provides detailed information about price movements and market sentiment. The visual format makes it easier to identify patterns.
- Disadvantages: May be overwhelming for beginners due to the variety of patterns and interpretations.
Candlestick Components
- Body: The filled or hollow portion of the candlestick represents the open and close prices. A filled body indicates a closing price lower than the opening price (bearish), while a hollow body indicates a closing price higher than the opening price (bullish).
- Wicks: The thin lines above and below the body represent the high and low prices during the time period.
- Color: The color of the body (often green for bullish and red for bearish) indicates market sentiment.
3. Analyzing Cryptocurrency Charts
3.1 Identifying Trends
Trends are the general direction in which a market is moving. Understanding trends is crucial for making informed trading decisions.
- Uptrend: Characterized by higher highs and higher lows. Traders may look for buying opportunities in an uptrend.
- Downtrend: Defined by lower highs and lower lows. Traders may seek selling opportunities in a downtrend.
- Sideways Trend: Occurs when prices move within a horizontal range. Traders may adopt a more cautious approach during sideways trends.
3.2 Support and Resistance Levels
Support and resistance levels are essential concepts in technical analysis, helping traders identify potential reversal points.
- Support Level: A price level where buying interest is strong enough to prevent the price from falling further. It acts as a “floor” for the asset.
- Resistance Level: A price level where selling interest is strong enough to prevent the price from rising further. It acts as a “ceiling” for the asset.
Traders often use support and resistance levels to set entry and exit points for trades.
3.3 Chart Patterns
Recognizing chart patterns can provide valuable insights into potential future price movements. Some common chart patterns include:
- Head and Shoulders: Indicates a reversal pattern that signals a potential trend change.
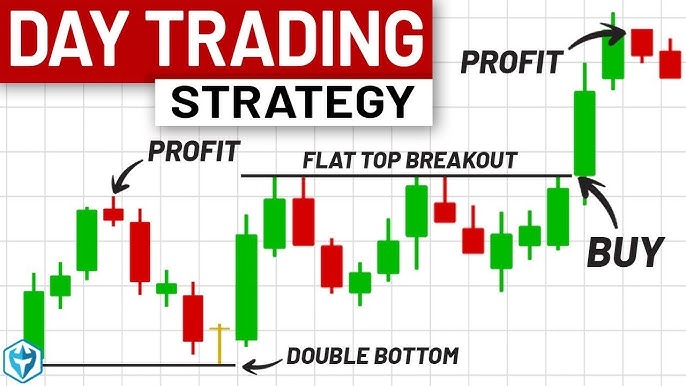
- Double Top/Bottom: Signals a reversal pattern where prices hit a resistance level twice (double top) or a support level twice (double bottom).
- Triangles: Symmetrical, ascending, or descending triangles indicate periods of consolidation and potential breakout points.
4. Key Indicators and Tools for Analysis
4.1 Moving Averages
Moving averages are widely used indicators that smooth out price data over a specified period, helping traders identify trends.
- Simple Moving Average (SMA): The average price over a specific time period, calculated by adding the closing prices and dividing by the number of periods.
- Exponential Moving Average (EMA): Similar to SMA, but gives more weight to recent prices, making it more responsive to current market conditions.
4.2 Relative Strength Index (RSI)
The RSI is a momentum oscillator that measures the speed and change of price movements. It ranges from 0 to 100 and helps traders identify overbought or oversold conditions.
- Overbought Condition: An RSI above 70 suggests that an asset may be overbought, indicating a potential price correction.
- Oversold Condition: An RSI below 30 suggests that an asset may be oversold, indicating a potential price rebound.
4.3 Moving Average Convergence Divergence (MACD)
The MACD is a trend-following momentum indicator that shows the relationship between two moving averages. It consists of the MACD line, signal line, and histogram.
- Bullish Signal: When the MACD line crosses above the signal line.
- Bearish Signal: When the MACD line crosses below the signal line.
4.4 Bollinger Bands
Bollinger Bands consist of a middle band (SMA) and two outer bands that represent price volatility. The distance between the bands varies based on market conditions.
- Squeeze: A narrow range between the bands indicates low volatility and potential price breakout.
- Overbought/Oversold: Prices touching the upper band suggest overbought conditions, while prices touching the lower band suggest oversold conditions.
5. Tips for Reading Cryptocurrency Charts
5.1 Start with a Demo Account
Before committing real funds, consider practicing with a demo account. Many trading platforms offer simulated trading environments, allowing beginners to familiarize themselves with chart reading and trading strategies without risk.
5.2 Focus on a Few Cryptocurrencies
As a beginner, it’s advisable to focus on a few cryptocurrencies to avoid feeling overwhelmed. Choose well-known cryptocurrencies with good liquidity to gain experience in reading their charts.
5.3 Combine Technical and Fundamental Analysis
While technical analysis is essential, combining it with fundamental analysis provides a more comprehensive view of the market. Stay informed about news, events, and developments affecting the cryptocurrencies you are trading.
5.4 Keep Learning
Cryptocurrency markets are dynamic and constantly evolving. Stay updated on market trends, charting techniques, and new trading strategies to improve your skills and decision-making.
6. Common Chart Reading Mistakes to Avoid
6.1 Overcomplicating Analysis
Beginners often make the mistake of overcomplicating their analysis by using too many indicators and tools. This can lead to confusion and indecision.
6.2 Ignoring Market Sentiment
Market sentiment plays a significant role in price movements. Beginners may focus solely on technical analysis without considering broader market factors, leading to misinformed decisions.
6.3 Not Having a Trading Plan
Trading without a clear plan can result in impulsive decisions and emotional trading. Establish a well-defined trading plan that includes entry and exit points, risk management strategies, and profit targets.
7. Conclusion
Reading cryptocurrency charts is a vital skill for any trader, providing insights into price movements, trends, and market sentiment. By understanding the basics of charts, recognizing patterns, and utilizing key indicators, beginners can make informed trading decisions.
With practice and continuous learning, you’ll develop the ability to analyze charts effectively and navigate the dynamic cryptocurrency market with confidence. Remember to stay disciplined, keep emotions in check, and continually refine your trading strategy for long-term success. Happy trading!


