Table of Contents
- What Are Fibonacci Retracements?
- The Fibonacci Sequence Explained
- How Fibonacci Levels Are Used in Forex
- Key Fibonacci Ratios and Levels
- How to Draw Fibonacci Retracement Levels
- Trading Strategies Using Fibonacci Retracements
- Strategy 1: Fibonacci with Trend Trading
- Strategy 2: Fibonacci with Support and Resistance
- Strategy 3: Combining Fibonacci with Other Indicators
- Using Fibonacci Retracements in Different Market Conditions
- Uptrend Market
- Downtrend Market
- Common Mistakes When Using Fibonacci Retracements
- Conclusion
1. What Are Fibonacci Retracements?
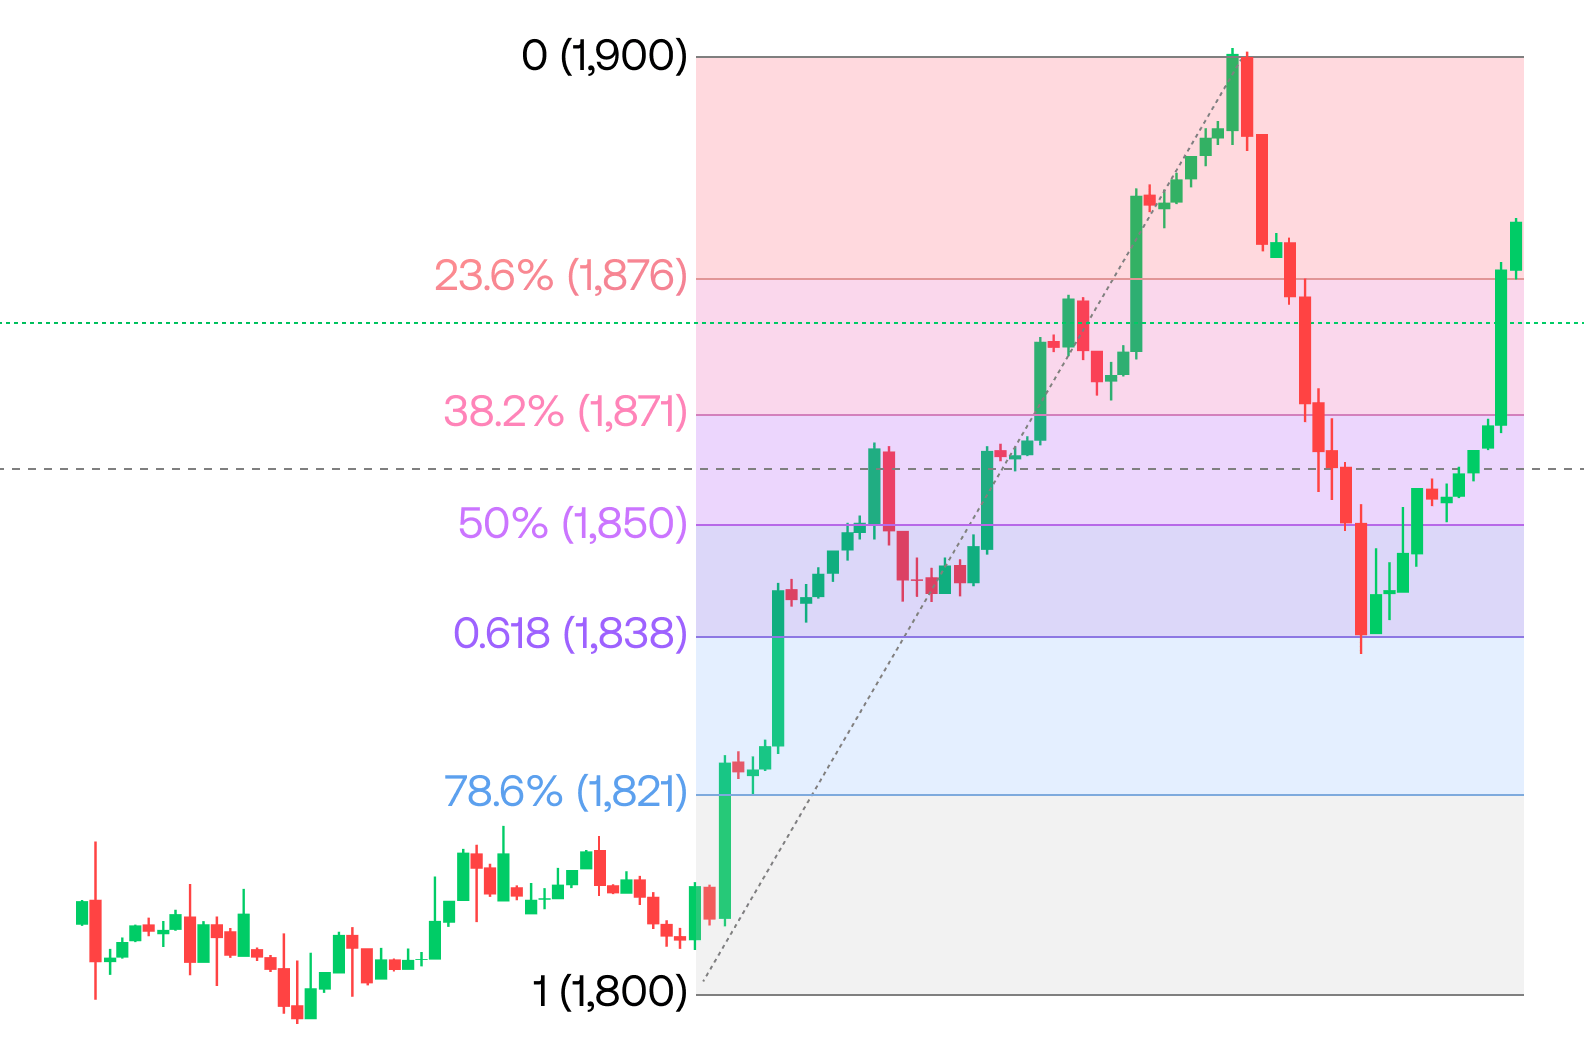
Fibonacci retracement levels are a technical analysis tool based on the Fibonacci sequence, which consists of numbers that generate key ratios often found in nature, mathematics, and finance. In forex, these retracement levels are used to identify areas where a currency pair’s price may experience a reversal or continuation of the trend.
Traders use Fibonacci retracements to plot potential entry and exit points by analyzing the price movement between a significant high and low. The idea behind using this tool is that prices will retrace a predictable portion of a move, typically in line with the Fibonacci ratios.
2. The Fibonacci Sequence Explained
The Fibonacci sequence is a series of numbers that starts with 0 and 1, and each subsequent number is the sum of the two preceding ones. The sequence goes like this: 0, 1, 1, 2, 3, 5, 8, 13, 21, 34, and so on. While the numbers themselves are fascinating, the real power of Fibonacci retracements in forex comes from the relationships between the numbers.
The key Fibonacci ratios (which we’ll discuss shortly) are derived from these numbers. For example:
- Any number in the sequence divided by the next number is approximately 0.618 (the Golden Ratio).
- Any number divided by the number two places ahead in the sequence is approximately 0.382.
- These ratios, and their derivatives, form the basis of Fibonacci retracement levels.
3. How Fibonacci Levels Are Used in Forex
Fibonacci retracements are applied to a forex chart by marking a significant price movement (either a high-to-low move or a low-to-high move) and plotting horizontal lines at key Fibonacci levels. These levels are typically 23.6%, 38.2%, 50%, 61.8%, and 100%.
How Traders Use Fibonacci Levels:
- Support and Resistance: Fibonacci levels often act as support or resistance, indicating areas where price could potentially reverse.
- Entry and Exit Points: Traders use Fibonacci retracement levels as entry points during pullbacks or corrections in the market.
- Targeting and Stop Losses: Fibonacci levels are used to set profit targets or stop-loss levels based on the expectation of price bouncing or breaking through a level.
4. Key Fibonacci Ratios and Levels
The key Fibonacci ratios used in forex trading are:
- 23.6%: This level is typically used in the early stages of retracements in strong trends.
- 38.2%: A significant level where price often finds support or resistance.
- 50%: Not a true Fibonacci ratio, but commonly used in forex as a halfway retracement point.
- 61.8%: Known as the “Golden Ratio,” this level is highly respected and is where many reversals tend to happen.
- 100%: The starting point or the full retracement level.
5. How to Draw Fibonacci Retracement Levels
Step-by-Step Guide:
- Identify a Trend: The first step is to identify a significant uptrend or downtrend in the forex market.
- Select Swing Highs and Lows: In an uptrend, identify the most recent swing low (the lowest point) and swing high (the highest point). In a downtrend, do the opposite.
- Apply Fibonacci Tool: Using your trading platform’s Fibonacci retracement tool, draw a line from the swing low to the swing high (or from high to low for a downtrend).
- Observe Fibonacci Levels: The tool will automatically plot horizontal lines at the key Fibonacci levels (23.6%, 38.2%, 50%, 61.8%, etc.).
Once the levels are plotted, they can guide your trading decisions by highlighting areas where price might pull back, consolidate, or reverse.
6. Trading Strategies Using Fibonacci Retracements
Strategy 1: Fibonacci with Trend Trading
In this strategy, traders use Fibonacci retracement levels to enter trades in the direction of the prevailing trend after a retracement or pullback. For example, during an uptrend:
- Wait for the price to retrace to one of the Fibonacci levels (e.g., 38.2% or 50%).
- Once the price bounces off the retracement level, enter a long position in the direction of the trend.
- Place a stop-loss just below the lowest swing low, and target the previous high or a Fibonacci extension level for profit.
Strategy 2: Fibonacci with Support and Resistance
In this strategy, Fibonacci levels are used in conjunction with key support and resistance levels:
- Identify strong support or resistance zones on the chart that coincide with Fibonacci retracement levels.
- Enter a trade when the price tests both a Fibonacci level and a support/resistance zone, as this increases the likelihood of the level holding.
- A break below or above a Fibonacci level could signal a trend reversal, while a bounce indicates a continuation.
Strategy 3: Combining Fibonacci with Other Indicators
Fibonacci retracements work best when combined with other technical indicators such as moving averages, MACD, or RSI:
- RSI (Relative Strength Index): If the price is near a Fibonacci level and the RSI indicates an oversold condition, this could be a signal to buy. Conversely, if the price is at a retracement level and the RSI shows an overbought condition, it could be a good time to sell.
- Moving Averages: A Fibonacci retracement level that coincides with a key moving average (such as the 50-day or 200-day moving average) can provide strong support or resistance.
7. Using Fibonacci Retracements in Different Market Conditions
Uptrend Market:
In an uptrend, traders use Fibonacci retracement levels to find buying opportunities. During a retracement, prices often pull back to key Fibonacci levels before continuing upward. For example:
- If price retraces to the 38.2% level and shows bullish momentum, this is a potential entry point for a long position.
Downtrend Market:
In a downtrend, traders use Fibonacci retracement levels to find selling opportunities. Prices often retrace to key Fibonacci levels before continuing lower. For example:
- If price retraces to the 61.8% level and shows bearish momentum, this is a potential entry point for a short position.
8. Common Mistakes When Using Fibonacci Retracements
Relying Solely on Fibonacci Levels
Fibonacci retracements are useful but should not be used in isolation. They are best used in combination with other technical indicators and market analysis to confirm signals.
Misidentifying Swing Points
Incorrectly choosing the swing high or low can lead to inaccurate Fibonacci retracement levels, which may result in poor trading decisions.
Ignoring Market Context
It’s important to consider the broader market context, including news events, market sentiment, and larger trends, when using Fibonacci retracements.
9. Conclusion
Fibonacci retracement is a powerful tool for forex traders, helping to identify potential levels of support and resistance, as well as entry and exit points. By understanding how to properly use Fibonacci retracements, you can improve your trading decisions and enhance your ability to predict market reversals. However, like any tool, it works best when combined with other technical indicators and sound risk management.
With practice and experience, Fibonacci retracements can become an essential part of your forex trading strategy. Whether you’re trading in an uptrend or downtrend, Fibonacci levels can offer valuable insights into potential price movements, helping you make more informed and profitable trades.


